Message from Boise Police Chief Ryan Lee
November 2, 2021
Over the last week, I and many other officers have heard from community members about how last week’s events disrupted their sense of safety. Whether the comments came from our friends and family, from community partners, or from the hundreds of people we make contact with every day, it’s clear that last week’s events left a significant impact on the community of Boise. The shooting at the mall was a shocking crime, happening in broad daylight at a place many of us have visited without incident. The end result was horrifying. Two people, Jo Acker and Roberto Padilla Arguelles lost their lives, multiple others were injured, and many more feared for their safety and the safety of their loved ones. Healing will take time.
It is natural, after an event like this, to question the overall safety of your community, so we want to share some data to help you make sense of it all.
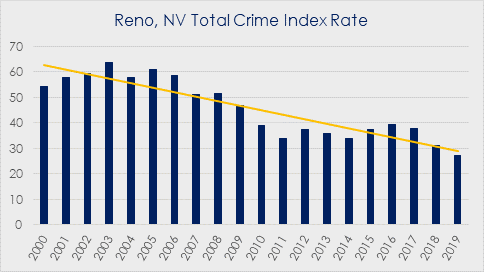
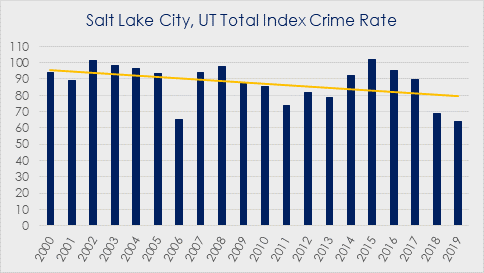
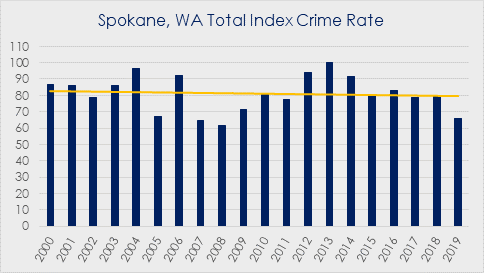
Crime in Boise has been on a downward trend for years and is among the lowest in the nation. Boise remains an incredibly safe city and we have made crime rates for comparable cities available here.
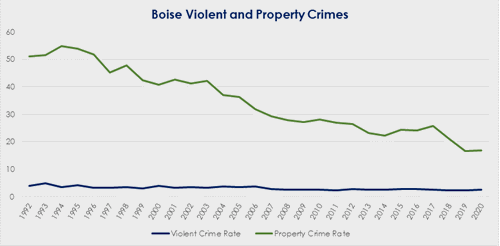
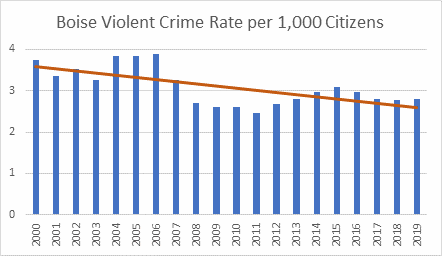
Even with an increase in population, the property crime rate in Boise is going down and the violent crime rate has stayed at a low level. When tragic, criminal events like the mall shooting happen, a natural reaction is to feel like violent crime is all around. The reality is Boise is safe. Most of the time, police in Boise are responding to incidents that involve a small number of people, a non-violent situation, and one that can be resolved with compassion and understanding. We have a great community. One that works with us to be proactive and report suspicious circumstances.
One way Boise works to keep the crime rate low is through community policing. In addition to patrol officers, we have officers dedicated to specialty roles where they work with community partners to problem solve before issues become criminal. Our officers have spent decades building up this model while also preparing for active threat events. It’s through those years of good preparation, training, leadership and recruiting that we are where we are today. We also know we must continue to find new ways to keep our community safe from violence and to protect what is equally important, our feeling of safety.
If you are looking for someone to talk to and ask questions about safety in Boise, our neighborhood contact officers are available to meet with community groups. You can also reach out to our Liaison officers; their contact information is also listed below.
As we look back on the tragic events of last week, I want to be sure to remark on how the community came together with donations, messages of thanks, and for an in-person vigil at the mall. There were also countless acts of heroism and bravery from officers and others in our community who stepped up to protect each other when we needed it most. I am more grateful than ever for the exceptional department and community I was privileged to join a little over a year ago. Boise Police officers have spent years committed to adapting and adjusting based on the needs of the community and we will continue to be there to keep Boise safe long into the future.
Neighborhood Contact Officers
Request a Neighborhood Contact officer for a community group or meeting:
Officer Jessica Knarr
Refugee Liaison
jknarr@cityofboise.org
Officer Blake Slater
NAACP Liaison
bslater@cityofboise.org
Officer Ed Moreno
Hispanic Community Liaison
emoreno@cityofboise.org
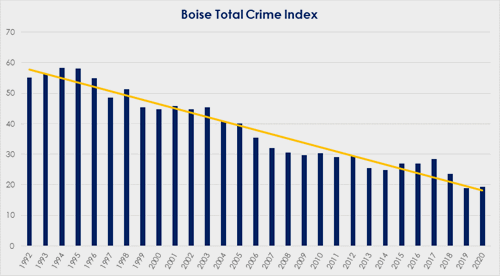
Crime in Boise
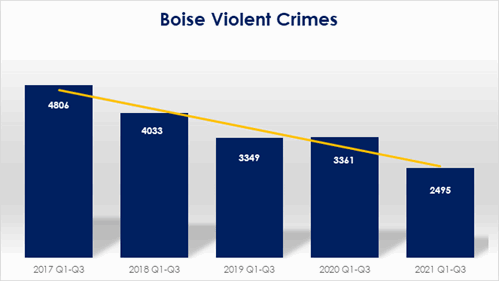
Crimes numbers shown in this chart include murder, rape, robbery, aggravated assault, burglary, theft, vehicle theft and arson. This chart shows numbers for the first three quarters of each year including 2021. These are total charges, not adjusted for population or population rate. This trend shows that crime reports are going down even though we know our population numbers are going up.
Top Calls for Service
Top 10 Public Initiated calls 2021 Quarter 2 | |
Welfare Check | 2831 |
Citizen Assist | 2289 |
Welfare Check 911 Hang up | 1542 |
Commercial Burglary Alarm | 1149 |
Problem with a subject | 1070 |
Domestic Dispute | 1019 |
Suspicious Vehicle | 983 |
Crash-non injury | 979 |
Theft report | 948 |
Supplemental Information | 792 |
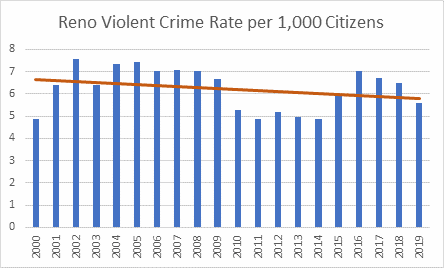
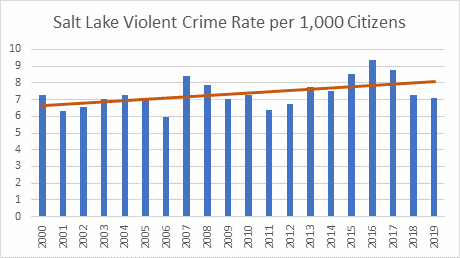
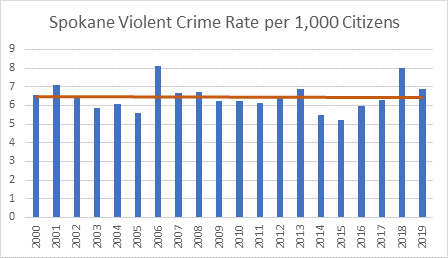
Violent Crime Rate per 1,000 Citizens
Contact: Boise Police Media Relations